Self-hosted home monitoring

In this project I measure the consumption of electricity, water and gas in my home. Also control the main devices that consume it. But, for privacy, I do not rely on any cloud service to do that. I built a system that is fully self-contained, so that my data stays at home.
The final version is not as polished as commercial solutions like Somfy or Ecojoko, but I'm proud of it!
In a nutshell
- Electricity consumption is measured by directly reading my Linky meter.
- Gas consumption is read with two simple wires connected to my Gazpar meter.
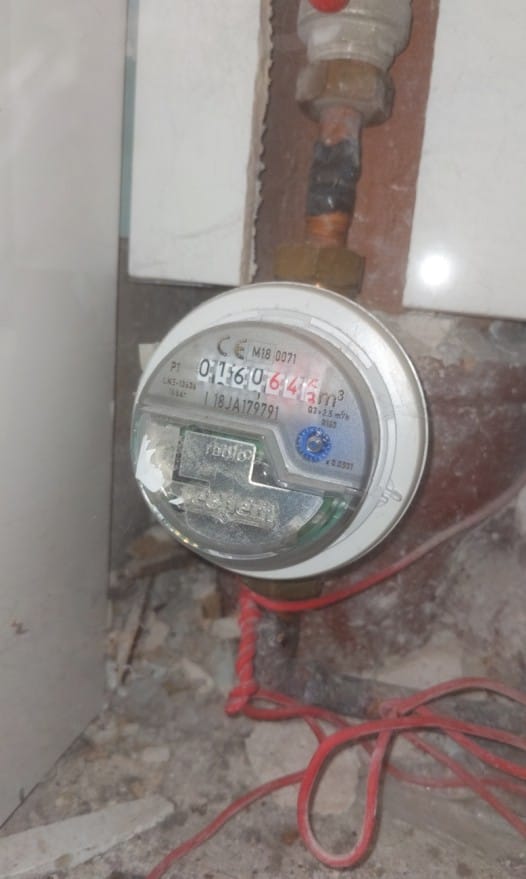
- Water is read with a wireless M-Bus receiver.
- Many devices, namely hot water tank, gas boiler, mechanical ventilation and bathroom electric radiator, are controlled with Shelly devices.
- Data is gathered by a Pine64 board running a lightweight Linux distribution, DietPi, with a small and simple frontend.
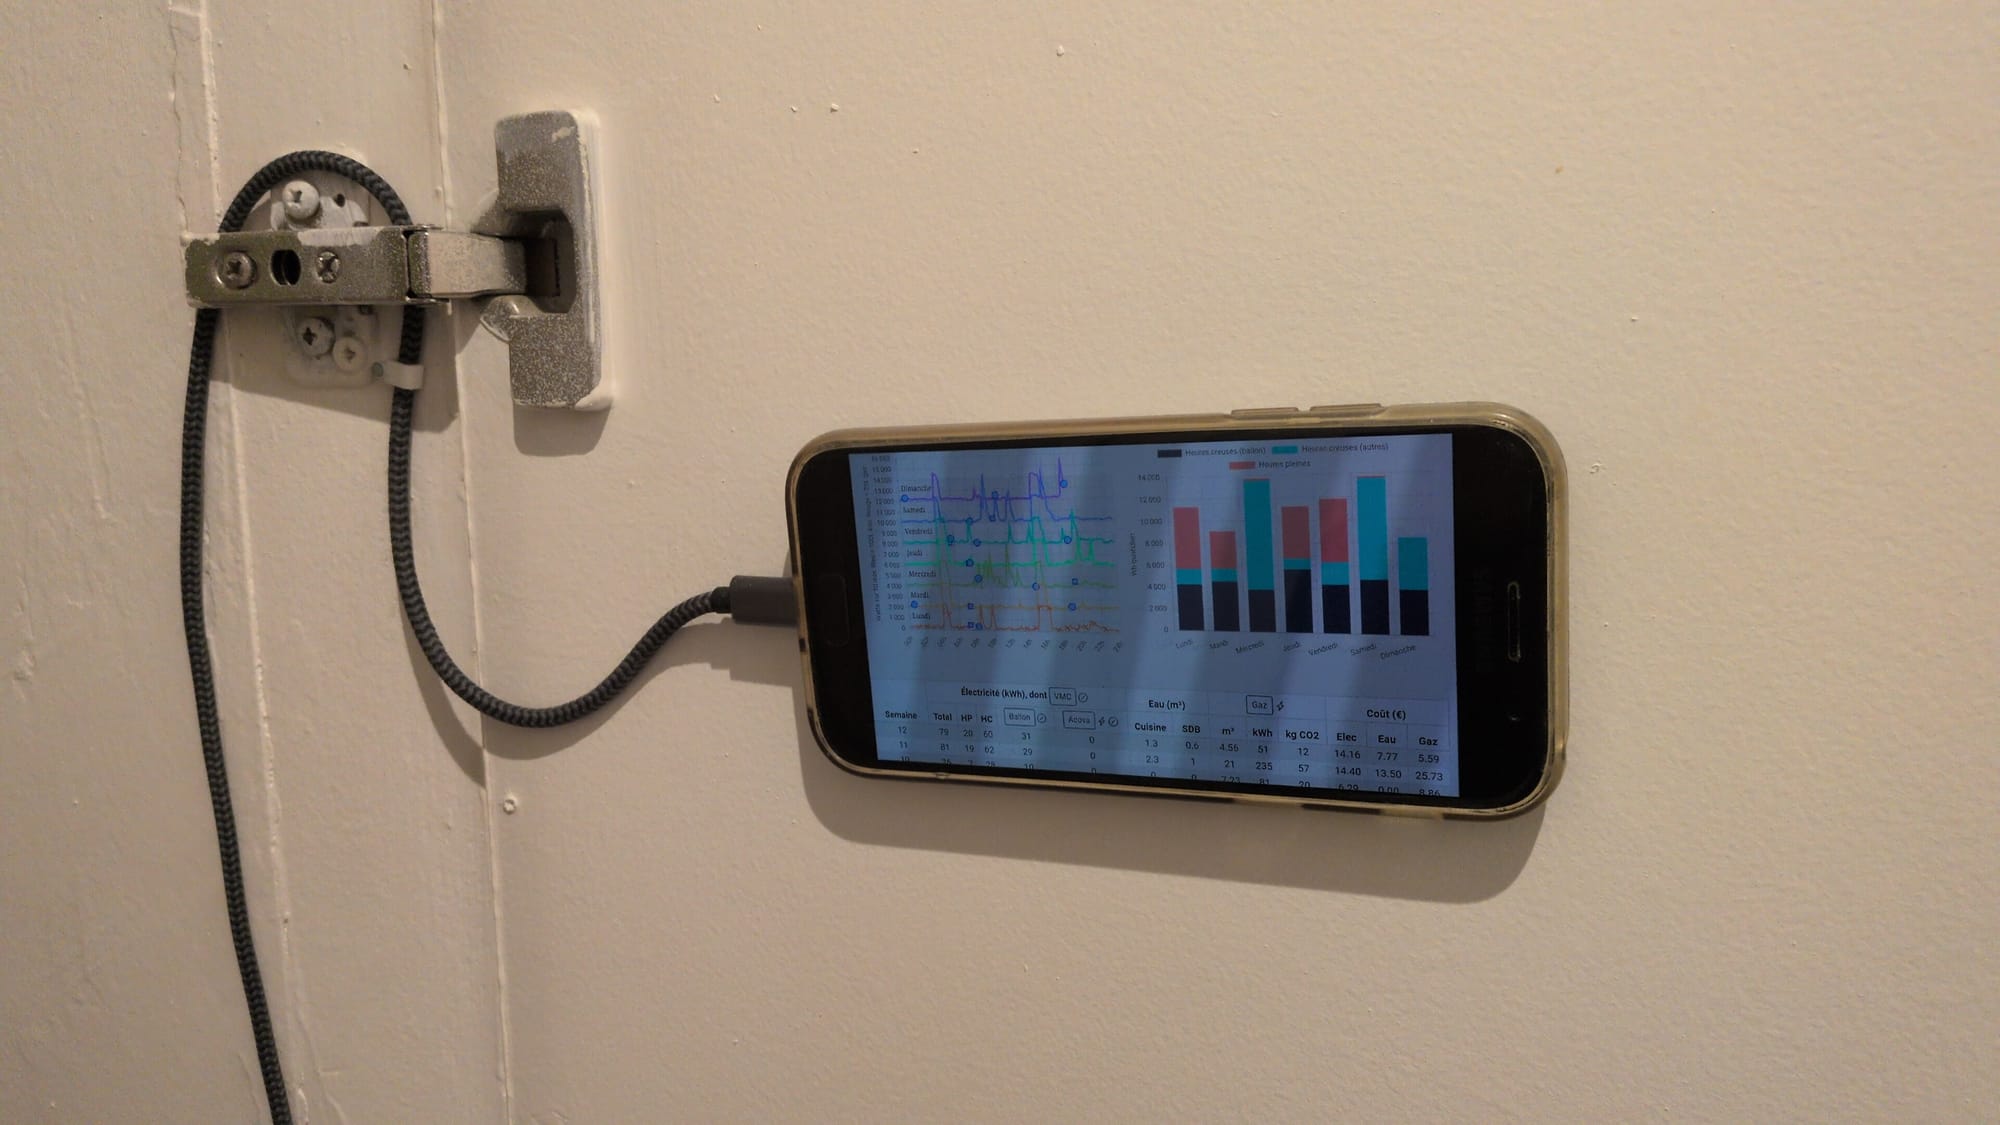
- A repurposed Android phone in kiosk mode serves as an always-on human interface for the system.
Measuring power draw with the Linky meter
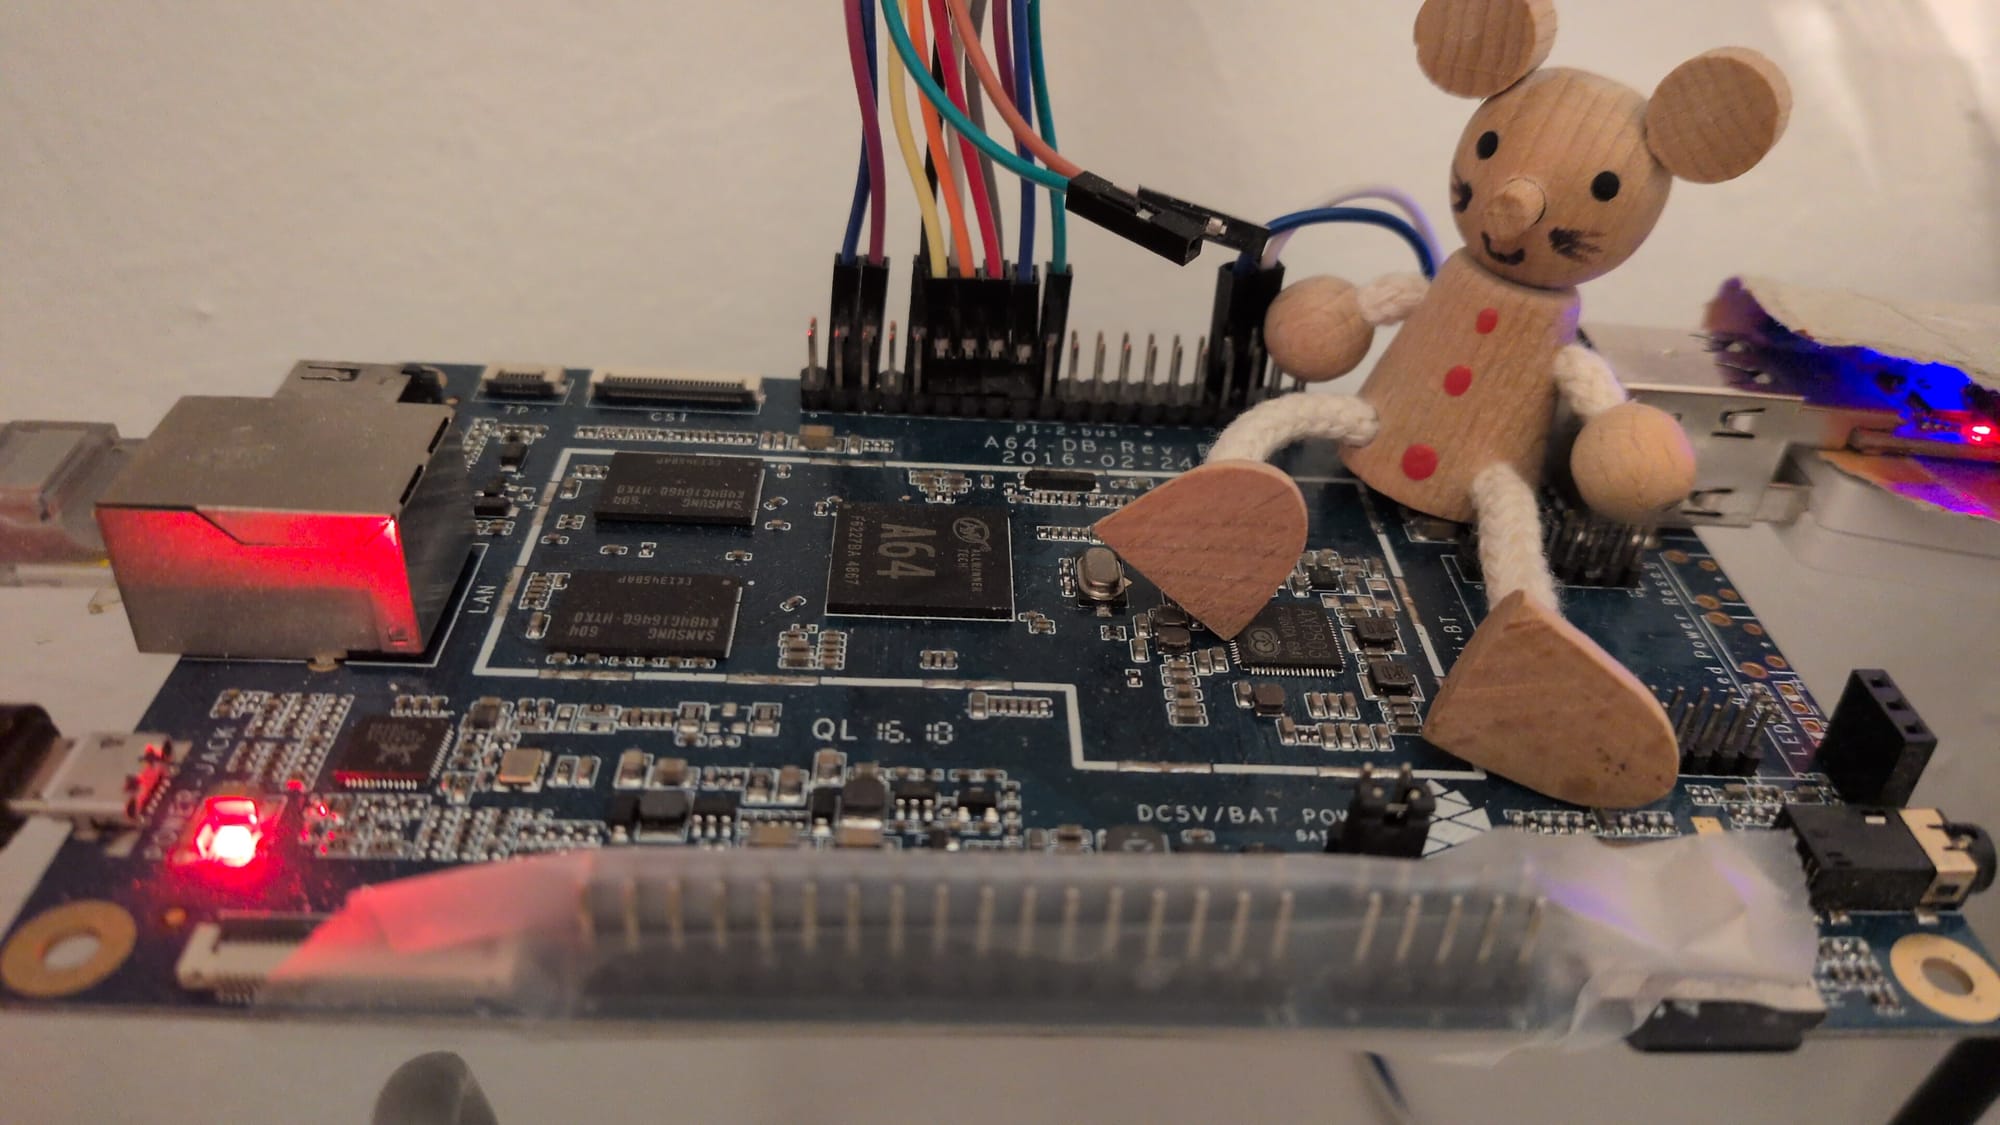
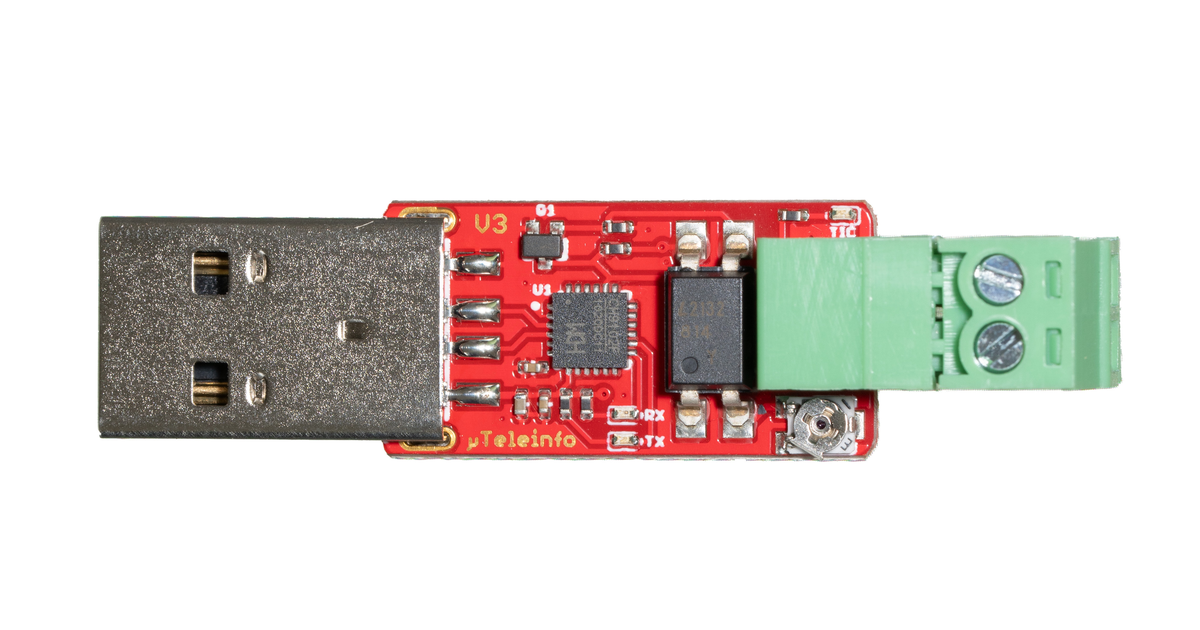
The Linky power meter has a special output, TIC (PDF spec), that allows us to locally read the meter, without any network connection to the energy provider. We need a little converter, from the two-wire TIC protocol to a convenient USB serial output. An embedded engineer, Charles Hallard, has built this great and inexpensive board:
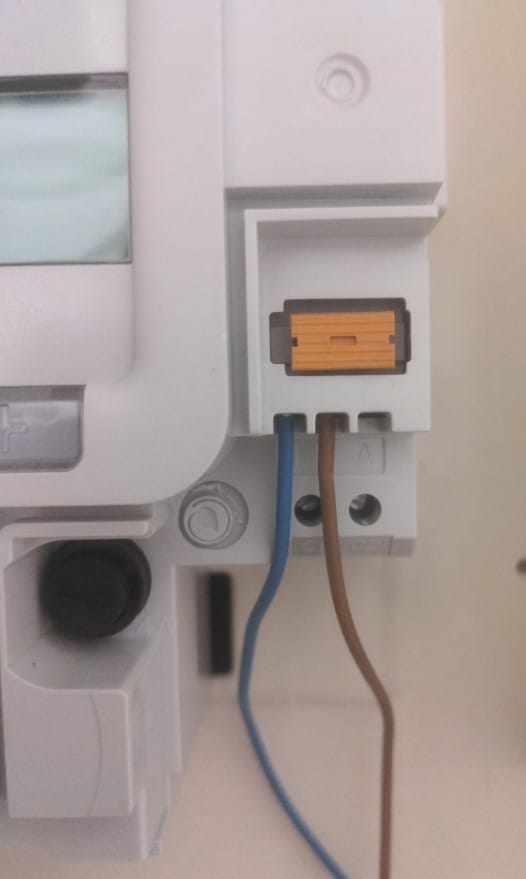
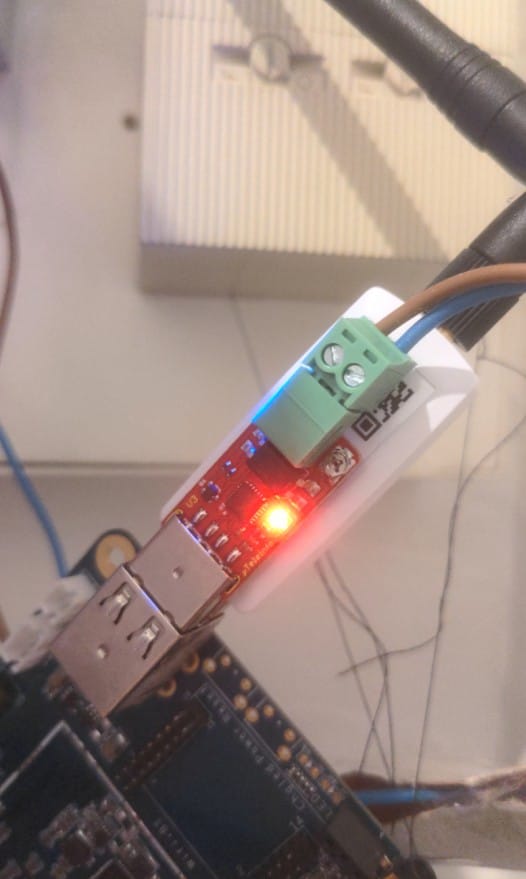
On the pictures, you see how to connect the Linky meter to the board. Then, I connect the USB to the Pine64 (could be a Raspberry Pi or equivalent).
We will talk to our dongle over a serial port using Node.JS. Let's install this library, then run a test script.
const { SerialPort } = require('serialport');

const port = new SerialPort({
  path: '/dev/ttyACM1', // could be ttyACM0, change if needed
  baudRate: 1200,
});

port.on('data', function (data) {
  const str = data.toString("ascii");
  console.log(str);
});

setTimeout(() => process.exit(0), 5000);
OPTARIF BASE 0
ISOUSC 30 9
BASE 001247807 (
PTEC TH.. $
IINST 005 \
IMAX 090 H
PAPP 01320 '
HHPHC A ,
MOTDETAT 000000 B
ADCO 022461424242 ;
OPTARIF BASE 0
ISOUSC 30 9
BASE 001247808 )
PTEC TH.. $
IINST 005 \
IMAX 090 H
PAPP 01320 '
HHPHC A ,
MOTDETAT 000000 B
ADCO 022461424242 ;
OPTARIF BASE 0
ISOUSC 30 9
BASE 001247808 )
PTEC TH.. $
IINST 005 \
IMAX 090 H
PAPP 01320 '
HHPHC A ,
MOTDETAT 000000 B
ADCO 022461424242 ;
OPTARIF BASE 0
ISOUSC 30 9
BASE 001247809 *
PTEC TH.. $This article is useful to make sense of these lines. Here we see that IINST, the current draw, is at 5 amperes (roughly 1200W), which makes sense as an oven (at target temperature) is cooking something at the moment. We also see that the BASE counter, counting the Watt-hours, has increased by 2 Wh over 5 seconds, which also makes sense as 2Wh / 5s ~ 1500W.
But I monitor the cumulative BASE value instead, as it is more convenient and reliable to compute consumptions over time frames of hours or days, even if the system is paused in between.
Here I compute average power draw over 10 minutes by calculating the difference in BASE between the two timestamps. As the meter is precise at the Watt-hour level, the values will have a resolution of 6 Watts, which is low enough to have interesting measurements when only a few devices are powered.
Measuring natural gas with the Gazpar meter
The Gazpar meter transmits the consumption with a radio module, but the data is packed an a custom encrypted protocol that is not directly accessible to the end users. Users have to connect to the GRDF customer page. The local method instead is to connect a wire to a special socket on the side of the meter.
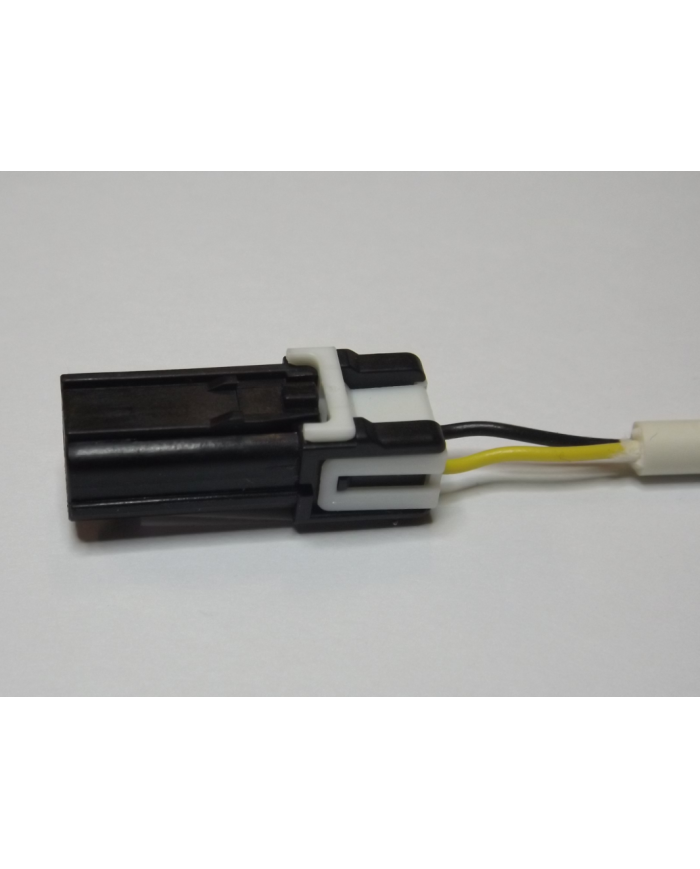
Then, I found inspiration in these two blog articles and connected that wire to the GPIO from the Pine64 (see spec).

I connected one wire of the cable to a ground pin (pin 34), then connected the other one to GPIO16 (pin 36). I setup the GPIO in pull-up mode, meaning that by default the signal read on GPIO16 will be a logical 1. From time to time (every 10 liters of gas), the Gazpar counter will close the circuit and connect the ground and the GPIO pin, so that GPIO measures a logical 0. Empirically, this transient phase lasts 200-300 ms. The driver I use on the Pine64 board does not support GPIO interrupts, so I fell back with a regular polling strategy, with a 100ms interval.
import RPi.GPIO as GPIO
import os
from time import sleep

readPin = 16

GPIO.setmode(GPIO.BCM)
GPIO.setup(readPin, GPIO.IN, pull_up_down=GPIO.PUD_UP)

lastread = 0

counter_file = "/run/gazpareader/counter"

while True:
        sleep(0.1)
        read = GPIO.input(readPin)
        if (read == lastread):
                continue

        if read == 0 and lastread == 1:
                with open(counter_file, 'rw') as f:
                        counter = int(f.read().strip() or '0')
                        counter += 1
                        f.write(str(counter))

        lastread = read
Here are sample results from this program, when logs are added. You notice blocks of Gazpar events, every 10 to 15 seconds, that last 200 to 300 ms. The heating cycles of my furnace appear, here every 10 minutes where 40 to 50 liters of gas are burnt.
2025-10-31T09:06:48.675739 1 => 0
2025-10-31T09:06:48.878314 0 => 1
2025-10-31T09:07:00.691059 1 => 0
2025-10-31T09:07:00.893506 0 => 1
2025-10-31T09:07:16.709995 1 => 0
2025-10-31T09:07:16.912607 0 => 1
2025-10-31T09:07:28.725369 1 => 0
2025-10-31T09:07:28.927931 0 => 1
2025-10-31T09:07:44.647485 1 => 0
2025-10-31T09:07:44.950142 0 => 1

2025-10-31T09:15:04.626882 1 => 0
2025-10-31T09:15:04.929679 0 => 1
2025-10-31T09:15:20.646739 1 => 0
2025-10-31T09:15:20.849270 0 => 1
2025-10-31T09:15:32.662568 1 => 0
2025-10-31T09:15:32.865157 0 => 1
2025-10-31T09:15:48.682349 1 => 0
2025-10-31T09:15:48.885009 0 => 1

2025-10-31T09:23:36.691963 1 => 0
2025-10-31T09:23:36.894451 0 => 1
2025-10-31T09:23:48.707164 1 => 0
2025-10-31T09:23:48.909622 0 => 1
2025-10-31T09:24:04.626956 1 => 0
2025-10-31T09:24:04.929621 0 => 1
2025-10-31T09:24:16.642472 1 => 0
2025-10-31T09:24:16.845131 0 => 1
2025-10-31T09:24:32.662709 1 => 0
2025-10-31T09:24:32.865351 0 => 1

2025-10-31T09:32:32.684054 1 => 0
2025-10-31T09:32:32.886519 0 => 1
2025-10-31T09:32:44.599092 1 => 0
2025-10-31T09:32:44.901822 0 => 1
2025-10-31T09:32:56.614839 1 => 0
2025-10-31T09:32:56.917606 0 => 1
2025-10-31T09:33:12.634544 1 => 0
2025-10-31T09:33:12.837132 0 => 1

2025-10-31T09:41:32.677480 1 => 0
2025-10-31T09:41:32.880131 0 => 1
2025-10-31T09:41:44.593000 1 => 0
2025-10-31T09:41:44.895699 0 => 1
2025-10-31T09:42:00.613087 1 => 0
2025-10-31T09:42:00.815792 0 => 1
2025-10-31T09:42:12.628638 1 => 0
2025-10-31T09:42:12.831241 0 => 1
2025-10-31T09:42:28.648590 1 => 0
2025-10-31T09:42:28.851180 0 => 1

2025-10-31T09:51:40.661438 1 => 0
2025-10-31T09:51:40.864105 0 => 1
2025-10-31T09:51:52.577068 1 => 0
2025-10-31T09:51:52.879989 0 => 1
2025-10-31T09:52:08.597245 1 => 0
2025-10-31T09:52:08.800002 0 => 1
2025-10-31T09:52:20.612684 1 => 0
2025-10-31T09:52:20.815586 0 => 1
2025-10-31T09:52:36.633137 1 => 0
2025-10-31T09:52:36.835828 0 => 1

2025-10-31T10:01:48.635619 1 => 0
2025-10-31T10:01:48.838218 0 => 1
2025-10-31T10:02:04.555265 1 => 0
2025-10-31T10:02:04.857931 0 => 1
2025-10-31T10:02:16.570723 1 => 0
2025-10-31T10:02:16.773334 0 => 1
2025-10-31T10:02:32.590489 1 => 0
2025-10-31T10:02:32.793052 0 => 1
2025-10-31T10:02:44.605962 1 => 0
2025-10-31T10:02:44.808523 0 => 1
Then we apply the formula kWh = m3 * coefficient where the coefficient is 11.18 in Paris. Each tick of the Gazpar meter means 10L = 0.01m3 of gas have been consumed, hence 0.1118kWh and ~0.01€.
Measuring usage of water with wireless MBus receiver
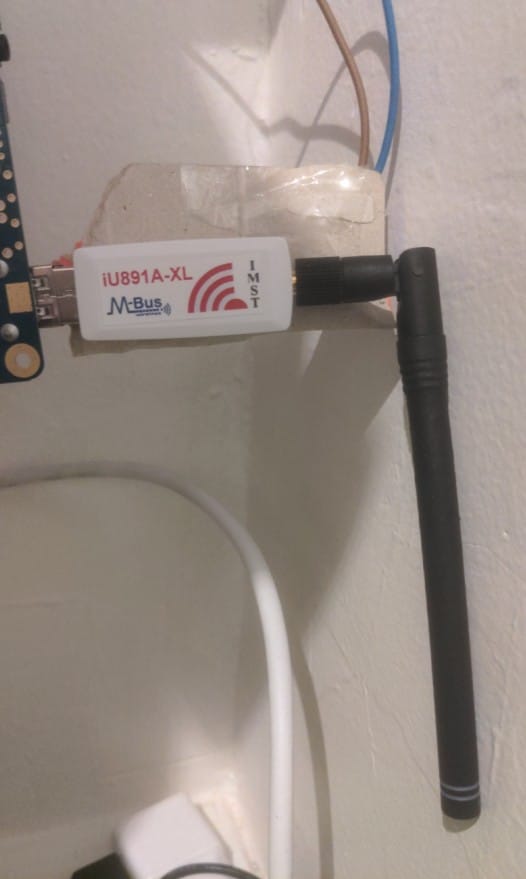
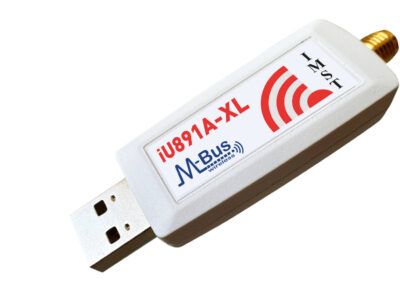
In Europe meters follow a standard wireless setup to broadcast data on the 868 MHz band: wireless M-Bus. To read the packets, I am using a special dongle, the iU891A-XL.
Living in an urban area, it is possible to read many water meters in the vicinity. The protocol supports encryption, but the people who installed it did not care. If I wanted, I could monitor how much and when my neighbors consume water. Or even emit fake packets to pretend I am not consuming water… (#desperatebusiness)
Install wmbusmeters and start the service.
sudo systemctl start wmbusmeters.serviceThe logs are of the following kind:
$ sudo journalctl -e -f -u wmbusmeters.service
12:14:03 wmbusmetersd[82710]: Started config iu891a[00202008] on /dev/ttyACM0 listening on t1,c1
12:14:03 wmbusmetersd[82710]: Received telegram from: 32411976
12:14:03 wmbusmetersd[82710]:           manufacturer: (TCH) Techem Service (0x5068)
12:14:03 wmbusmetersd[82710]:                   type: Cold water (0x72)
12:14:03 wmbusmetersd[82710]:                    ver: 0x74
12:14:03 wmbusmetersd[82710]:                 device: iu891a[00202008]
12:14:03 wmbusmetersd[82710]:                   rssi: -85 dBm
12:14:03 wmbusmetersd[82710]:                 driver: mkradio3
12:14:03 wmbusmetersd[82710]: telegram=|_2F446850761941327472A2069F31C8103031270100000316160A06160E121016111C1D151816150B18131B1A1C1A1E0D|+17
12:14:04 wmbusmetersd[82710]: Received telegram from: 73161128
12:14:04 wmbusmetersd[82710]:           manufacturer: (TCH) Techem Service (0x5068)
12:14:04 wmbusmetersd[82710]:                   type: Cold water (0x72)
12:14:04 wmbusmetersd[82710]:                    ver: 0x50
12:14:04 wmbusmetersd[82710]:                 device: iu891a[00202008]
12:14:04 wmbusmetersd[82710]:                   rssi: -100 dBm
12:14:04 wmbusmetersd[82710]:                 driver: unknown!
12:14:04 wmbusmetersd[82710]: telegram=|_36446850281116735072A20C00133343110000010600191500131800200F001218002F1D00101C001B21001618001E1B00161F00181500|+18
12:14:04 wmbusmetersd[82710]: Received telegram from: 73752124
12:14:04 wmbusmetersd[82710]:           manufacturer: (TCH) Techem Service (0x5068)
12:14:04 wmbusmetersd[82710]:                   type: Cold water (0x72)
12:14:04 wmbusmetersd[82710]:                    ver: 0x50
12:14:04 wmbusmetersd[82710]:                 device: iu891a[00202008]
12:14:04 wmbusmetersd[82710]:                   rssi: -103 dBm
12:14:04 wmbusmetersd[82710]:                 driver: unknown!
12:14:04 wmbusmetersd[82710]: telegram=|_36446850242175735072A20C00133333050000030E000D11000F09000808000709000707000507000707000807000709000A08000B0C00|+18
12:14:05 wmbusmetersd[82710]: Received telegram from: 73161142
12:14:05 wmbusmetersd[82710]:           manufacturer: (TCH) Techem Service (0x5068)
12:14:05 wmbusmetersd[82710]:                   type: Cold water (0x72)
12:14:05 wmbusmetersd[82710]:                    ver: 0x50
12:14:05 wmbusmetersd[82710]:                 device: iu891a[00202008]
12:14:05 wmbusmetersd[82710]:                   rssi: -106 dBm
12:14:05 wmbusmetersd[82710]:                 driver: unknown!
It is not obvious to know which meter is which, as the numbers are not the same as the identifiers physically marked on them. The workaround is to monitor the rssi value, i.e. the strength of the signal and find the meter with the highest one, usually around -45 dBm when the antenna is at around one meter from the meter. Plug the antenna in a laptop and walk next to the meter.
$ sudo journalctl -e -f -u wmbusmeters.service | grep rssi
12:14:40 wmbusmetersd[82710]:                   rssi: -88 dBm
12:14:41 wmbusmetersd[82710]:                   rssi: -104 dBm
12:14:42 wmbusmetersd[82710]:                   rssi: -103 dBm
12:14:42 wmbusmetersd[82710]:                   rssi: -53 dBm
12:14:42 wmbusmetersd[82710]:                   rssi: -98 dBm
12:14:42 wmbusmetersd[82710]:                   rssi: -103 dBm
12:14:43 wmbusmetersd[82710]:                   rssi: -102 dBm
12:14:43 wmbusmetersd[82710]:                   rssi: -105 dBm
12:14:44 wmbusmetersd[82710]:                   rssi: -107 dBm
12:14:44 wmbusmetersd[82710]:                   rssi: -106 dBm
12:14:45 wmbusmetersd[82710]:                   rssi: -45 dBm
12:14:46 wmbusmetersd[82710]:                   rssi: -99 dBm
12:14:46 wmbusmetersd[82710]:                   rssi: -103 dBm
12:14:47 wmbusmetersd[82710]:                   rssi: -90 dBm
12:14:47 wmbusmetersd[82710]:                   rssi: -103 dBm
12:14:47 wmbusmetersd[82710]:                   rssi: -105 dBm
12:14:47 wmbusmetersd[82710]:                   rssi: -92 dBm
12:14:48 wmbusmetersd[82710]:                   rssi: -93 dBm
12:14:48 wmbusmetersd[82710]:                   rssi: -104 dBm
12:14:49 wmbusmetersd[82710]:                   rssi: -101 dBm
12:14:50 wmbusmetersd[82710]:                   rssi: -103 dBm
12:14:51 wmbusmetersd[82710]:                   rssi: -91 dBm
12:14:51 wmbusmetersd[82710]:                   rssi: -97 dBm
Do you notice the line with -45 dBm ? This is our meter. -53 dBm is probably the neighbor upstairs. Go in the full logs and find the 8-digit meter number of interest.
Now that you have identified the meter, create a config to monitor that one exclusively
$ cat /etc/wmbusmeters.d/EauCuisine
name=EauCuisine
id=42424242
driver=mkradio3a
Customize wmbusmeters config
$ cat /etc/wmbusmeters.conf
loglevel=silent
device=iu891a:c1,t1
logtelegrams=false
format=json
meterfiles=/run/wmbusmeters
meterfilesaction=overwrite
Plug the antenna in the home automation device. The measurements will be saved as JSON on the disk.
$ cat /run/wmbusmeters/EauCuisine
{
  "_": "telegram",
  "media": "cold water",
  "meter": "mkradio3a",
  "name": "EauCuisine",
  "id": "42424242",
  "last_apr_m3": 4.2,
  "last_aug_m3": 0.6,
  "last_dec_m3": 5.3,
  "last_feb_m3": 4.4,
  "last_jan_m3": 6,
  "last_jul_m3": 1.7,
  "last_jun_m3": 6.1,
  "last_mar_m3": 6.9,
  "last_may_m3": 6.2,
  "last_nov_m3": 6,
  "last_oct_m3": 6.3,
  "last_sep_m3": 7.3,
  "target_m3": 0.6,
  "total_m3": 321,
  "target_date": "2025-08-19T02:00:00Z",
  "timestamp": "2025-08-19T10:30:24Z",
  "device": "iu891a[00202008]",
  "rssi_dbm": -68
}
The total_m3 field is the one I will monitor. It has a precision of a tenth of a cubic meter, i.e. 100 liters, which is not sharp enough to analyze usage during a day, but is enough to compare weekly consumption.
Addendum: the iU891A-XL key has a glitch that causes the measurements to stop every once in a while. The key needed to be physically unplugged and plugged again for the system to work again. After some research, a special black magic command can be sent to the device to make it work again.
#!/bin/bash
echo -ne '\xc0\x09\x03\x00\x08\x00\x05\x00\x32\x00\xdb\xdc\x27\x09\x00\xf1\x32\xc0' > /dev/ttyACM0
and in wmbusmeters.conf
alarmshell=/path/reset.sh
alarmtimeout=3h
Controlling Acova bathroom heater
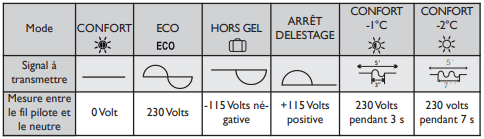
The bathroom heater has three wires: brown is the phase, gray is the neutral and black is a special one: command wire, or "fil pilote".
Brown and gray bring the bulk of the power and the black wire can hold various signals on to instruct the heater to heat or not. I have done two installations in the last months, using a Shelly Plus 2PM. The first was the simplest and sent the full phase signal in the command wire, leading the heater to be in "eco" mode, that reduces the thermostat target temperature (I don't know by how much exactly). This worked to some extent but required to tune the thermostat knob to a precise value so that the heater would actually go on and off when desired.
In the second setup, I have installed a diode so that the command wire sends only half of the phase signal. Whatever the direction of the diode, it causes the heater to basically stop heating. This is useful to automatically heat just before and/or after a shower, so that moisture can be evacuated. But in the end, I rarely use that heater.
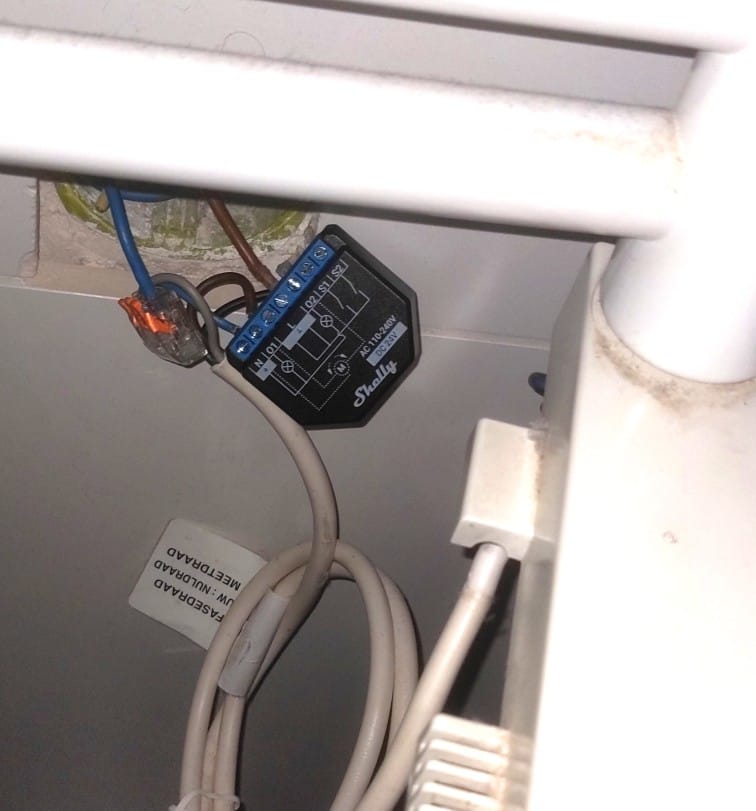
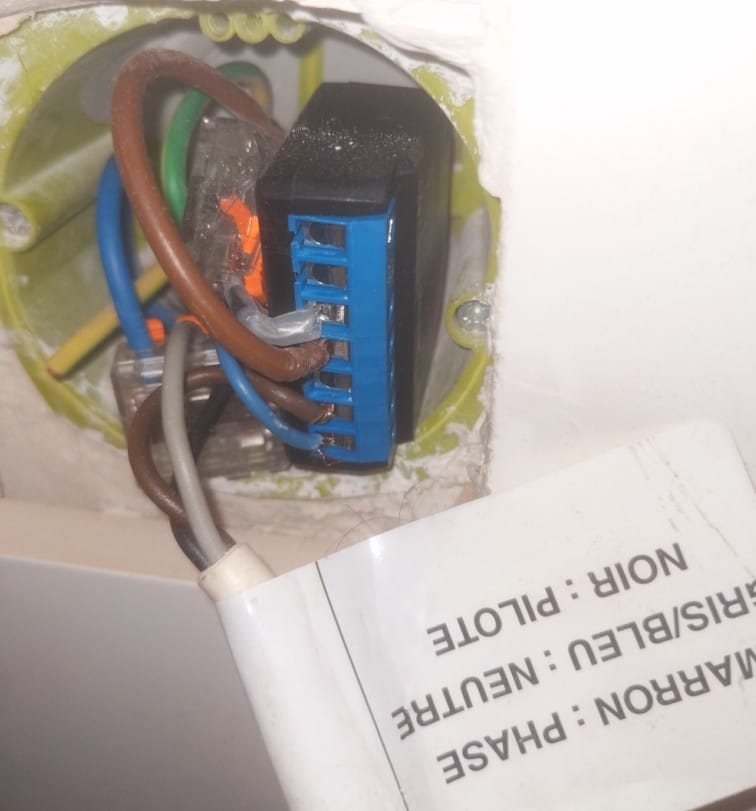
Left: initial setup with toggle between confort and eco mode. Right: final setup with full on/off toggle + délestage toggle that uses a diode.
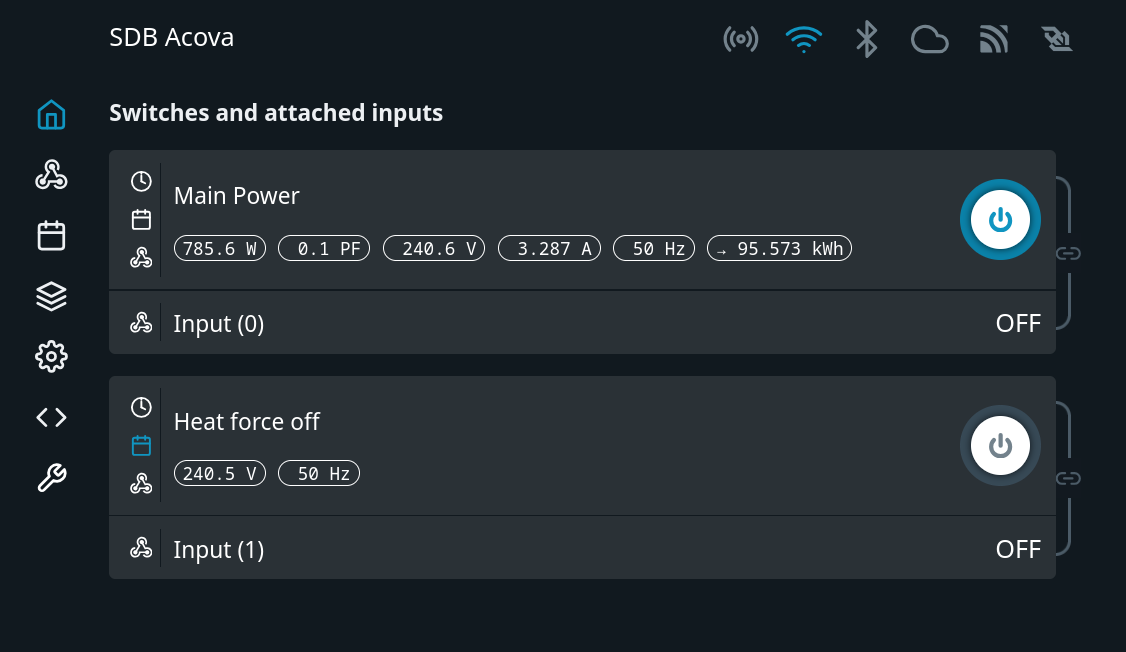
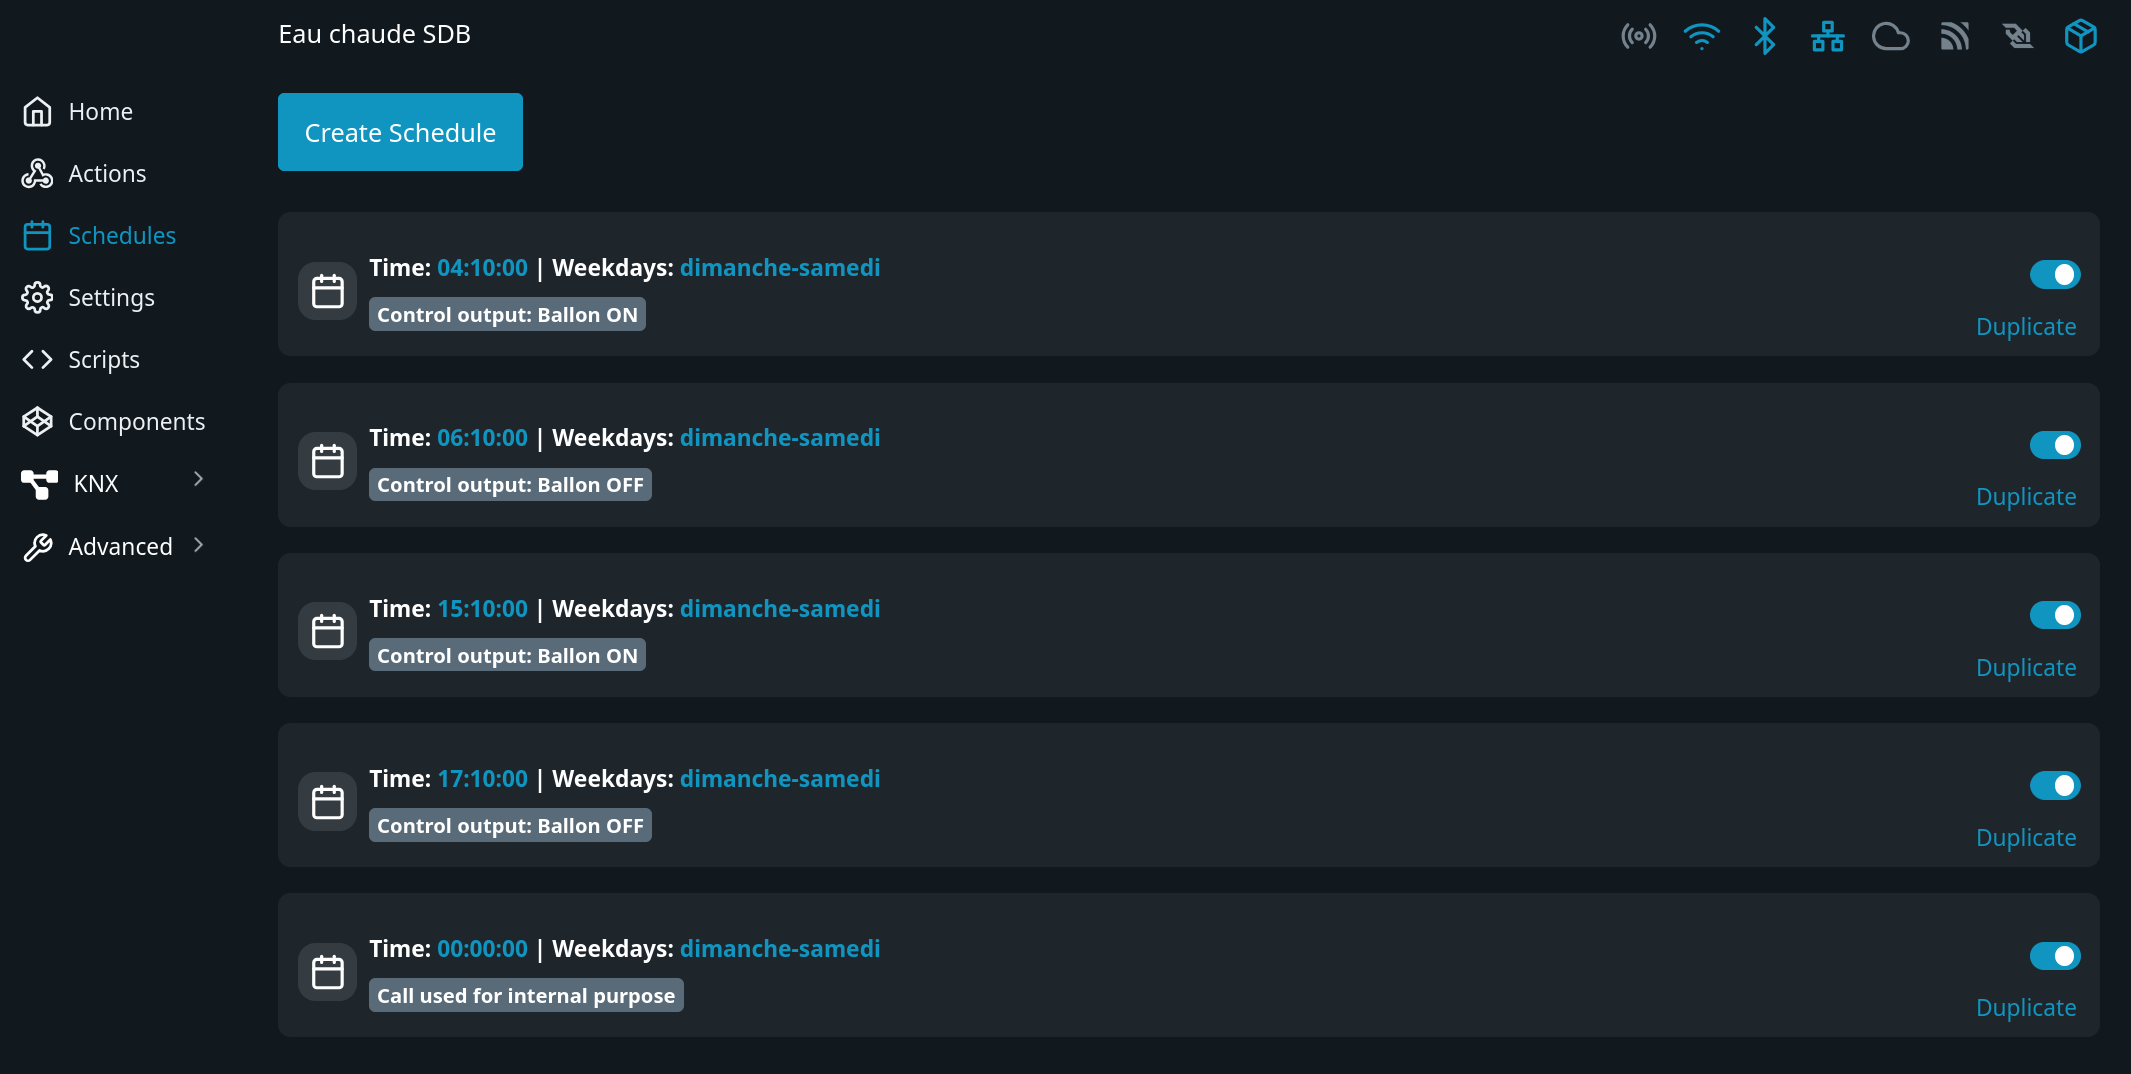
Controlling water heating for the bathroom
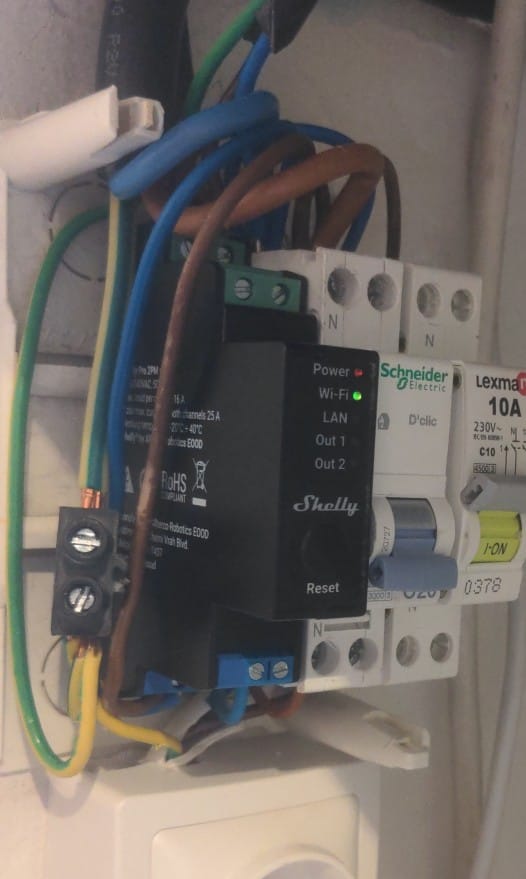
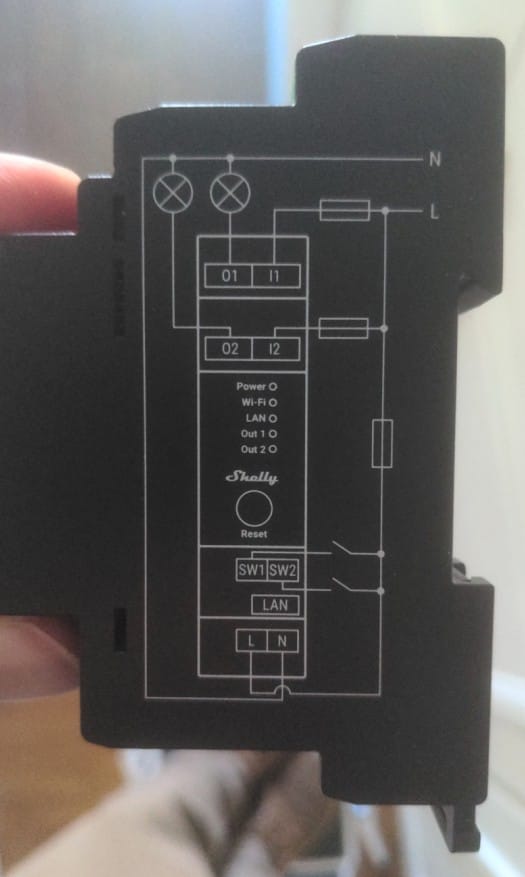
I am not very proud of that wiring...
Using a Shelly Pro 2PM. I program the heater to work at two periods of the day, during off-peak hours and just before we take the showers in the family. This limits the time where the water stays hot and heat is lost. During holidays, I disable heating by going in this menu and save some kilowatt-hours.
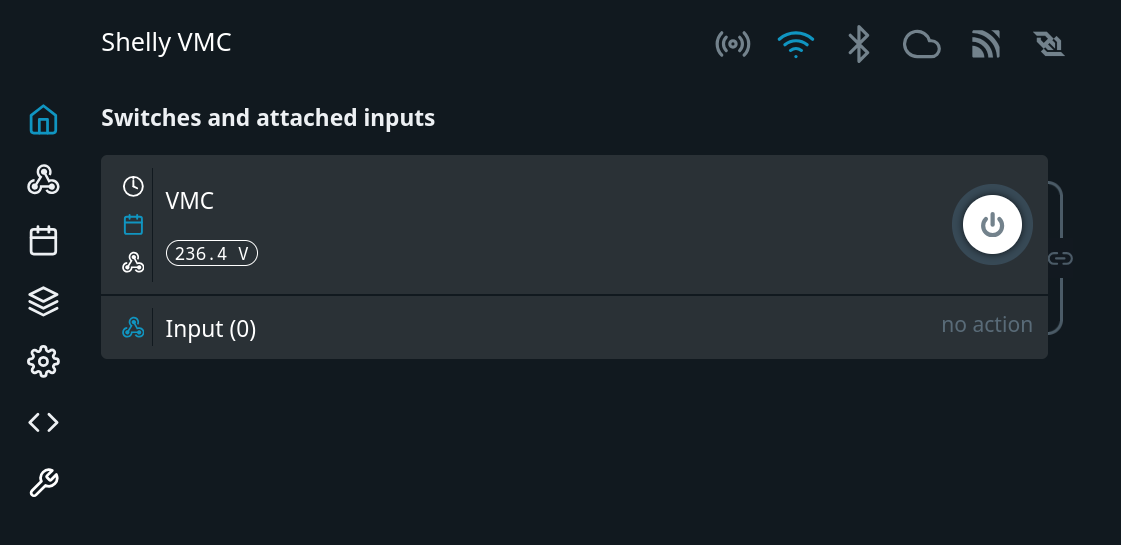
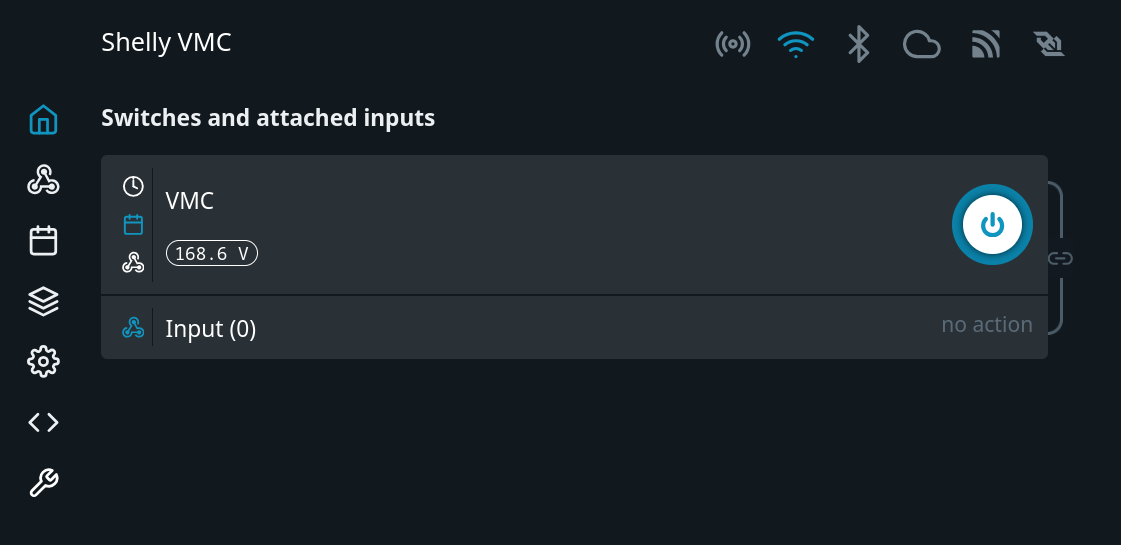
Controlling the mechanical ventilation
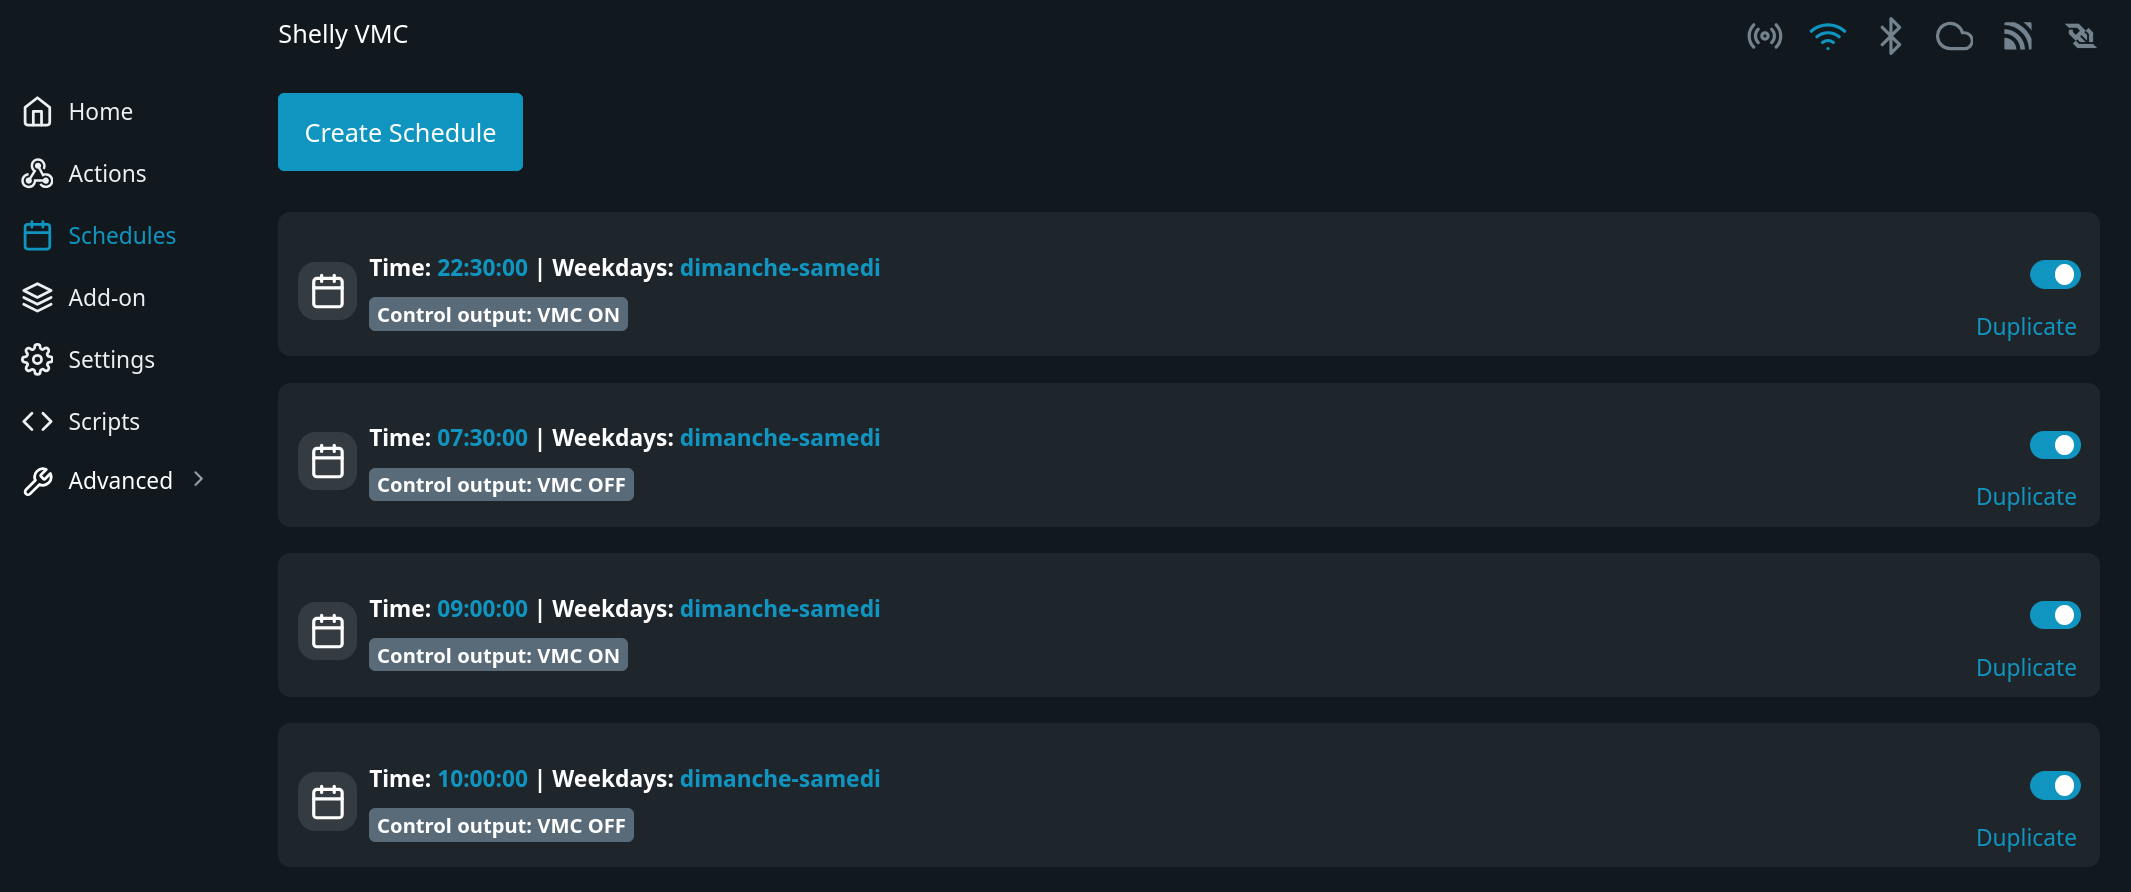
Here, I used a Shelly Plus 1PM, now retired. Interestingly, the measured voltage is very different between when the ventilation is on and off. It seems to be due to the high inductance of the ventilation motor, that should be compensated with a RC snubber. I bought one, but never bothered to install it, as it works as-is without any hiccups.
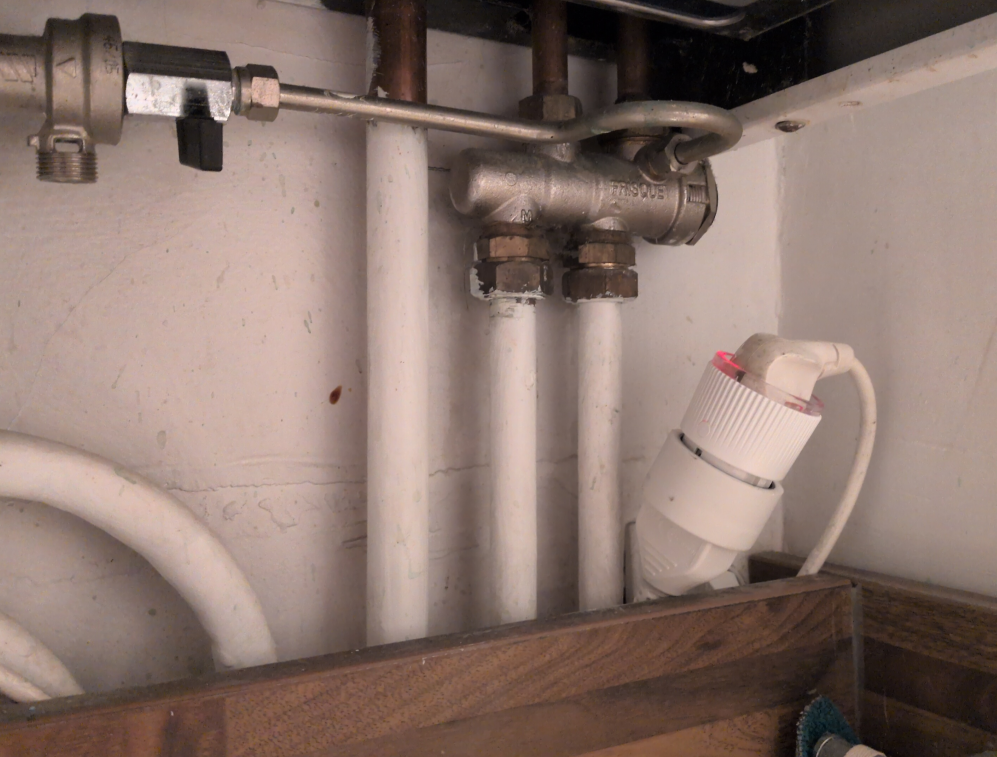
Controlling the furnace
My gas furnace is an old-fashioned one, of the brand Frisquet. A remote control is supposed to work with it but I find the concept of controlling the heating of the whole apartment by picking the temperature in just one point is not convenient. E.g. if I place the remote control in the living room but decide to stop the heating there during the night, the furnace will work too much to try to heat it.
This furnace seems to have a connector to control the heating, but it works with a dedicated module, that probes the temperature at a single location in the apartment, so still not practical.
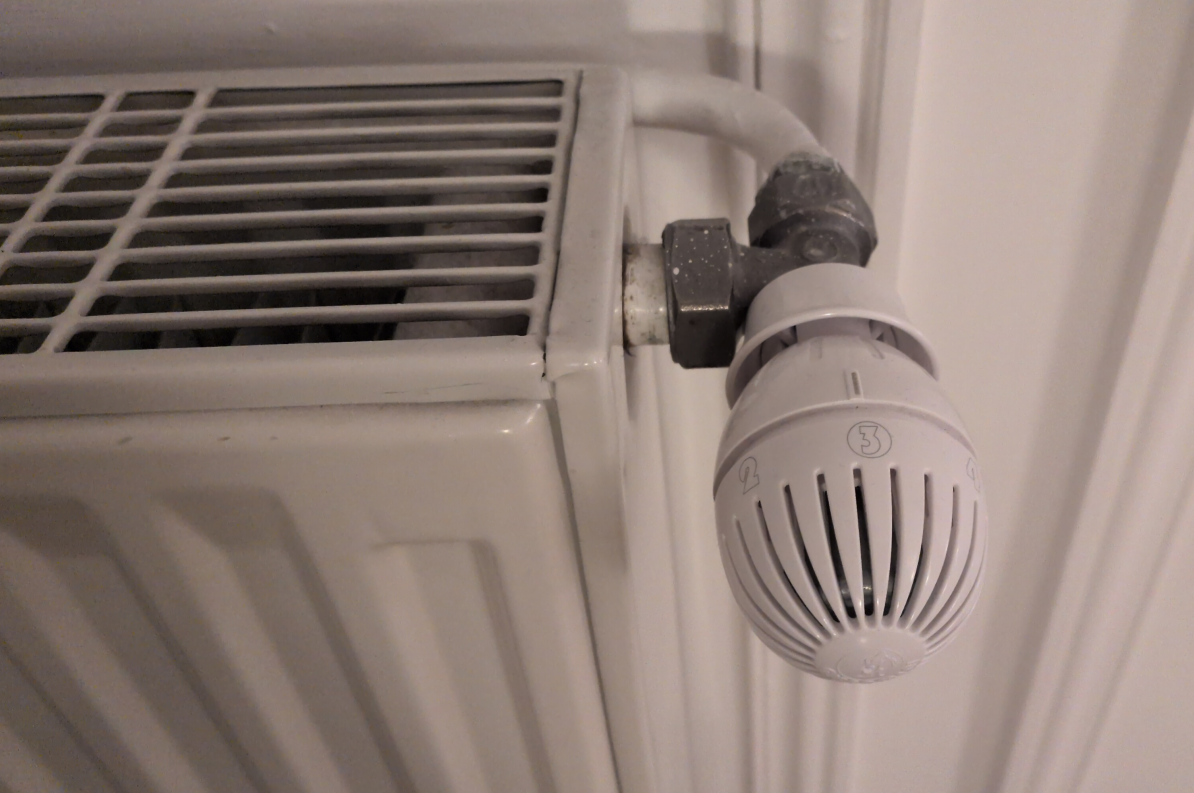
Instead, I used a rudimentary method to stop the furnace when away and start when present: the on-off button. It is possible to control it remotely with a Shelly Plug S, but I find myself rarely using it. Thermostatic valves are installed on key radiators and I tune the temperature of the water in the system to be just above what is needed to heat the place.
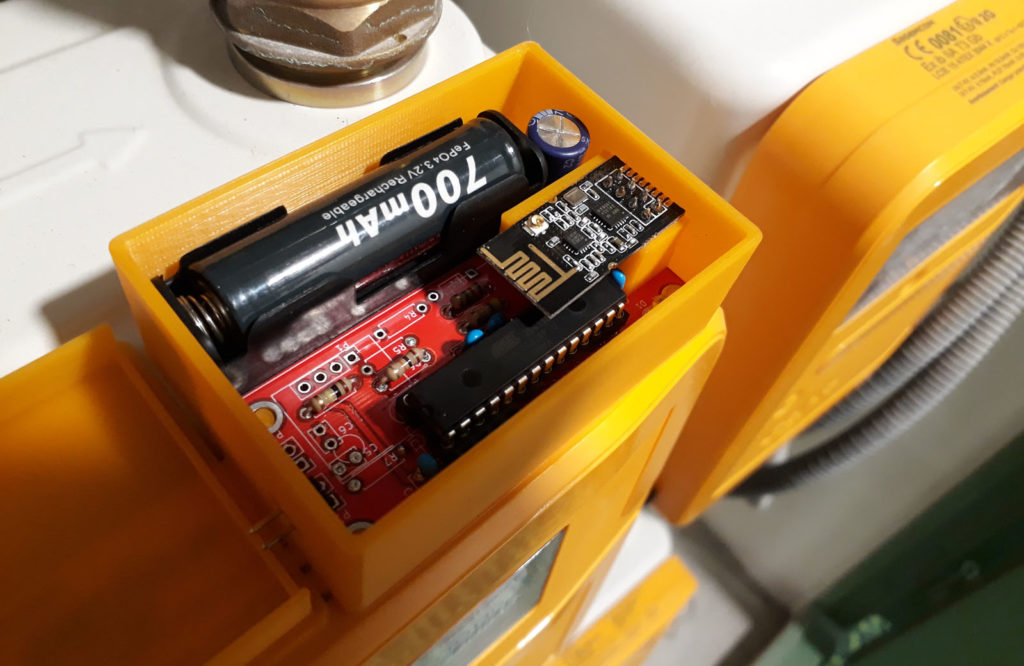
Gathering data
All data is gathered on a small computer I had in the drawer, the Pine A64. It is similar to the well known Raspberry Pi. I use a lightweight Debian-based distribution on it, DietPi, which proved to be easy to use and reliable.
Here is the final program that saves consumptions of gaz, water and electricity in a small SQLite database. It contains fail-safe logic. Code is crude and I don't care.
const { SerialPort } = require('serialport');
const { Database } = require('sqlite3');
const { open } = require('sqlite');
const axios = require("axios");
const fs = require("fs");

let db;
(async () => {
  db = await open({
    filename: 'datalinky.db',
    driver: Database
  });
  db.run(`CREATE TABLE IF NOT EXISTS "meter" (
    "time"      INTEGER NOT NULL UNIQUE,
    "meter"       INTEGER NOT NULL,
    "ballon"      INTEGER NOT NULL,
    "acova"       INTEGER NOT NULL,
    "eaucuisine"  NUMERIC,
    "eausdb"      NUMERIC,
    "gaz" NUMERIC,
    PRIMARY KEY("time"))`);
  console.log("connected to db");
})();

// Create a port
const port = new SerialPort({
  path: '/dev/ttyACM1',
  baudRate: 1200,
});
console.log("connected to serial port");

let processingMeterLine = false;

port.on('data', async function (data) {
  const str = data.toString("ascii");
  console.log(str);
  if (str.slice(0, 5) === "BASE " && !processingMeterLine) {
    const index = Number.parseInt(str.split(" ")[1]);
    if (index === 0 || isNaN(index)) return;

    processingMeterLine = true;
    const time = Math.floor(+new Date() / 1000);
    console.log("Logged meter ", index, " at ts ", time);

    const { data: dataBallon } = await axios.get(`http://192.168.0.XX/rpc/Switch.GetStatus?id=0`);
    const ballonMeter = Math.round(dataBallon?.aenergy?.total) || 0;

    const { data: dataAcova } = await axios.get(`http://192.168.0.YY/rpc/Switch.GetStatus?id=0`);
    const acovaMeter = Math.round(dataAcova?.aenergy?.total) || 0;

    // get old readings in case the temporary file is not there yet
    const oldMeter = await db.all("SELECT eaucuisine, eausdb, gaz FROM meter ORDER BY time DESC LIMIT 1");
    let EauSDB = oldMeter[0].eausdb;
    let EauCuisine = oldMeter[0].eaucuisine;
    let gazCounter = parseInt(oldMeter[0].gaz) || 0;

    try {
      EauSDB = JSON.parse(fs.readFileSync("/run/wmbusmeters/EauSDB")).total_m3;
      EauCuisine = JSON.parse(fs.readFileSync("/run/wmbusmeters/EauCuisine")).total_m3;
    } catch (e) {
      console.warn(e);
    }

    try {
      const gazCounterIncrement = parseInt(fs.readFileSync("/run/gazpareader/counter"));
      if (gazCounterIncrement > 0) fs.writeFileSync("/run/gazpareader/counter", "0");
      gazCounter += gazCounterIncrement;
    } catch (e) {
      console.warn(e);
    }

    await db.run(
      "INSERT INTO meter (time, meter, ballon, acova, eaucuisine, eausdb, gaz) VALUES (?, ?, ?, ?, ?, ?, ?)",
      [time, index, ballonMeter, acovaMeter, EauCuisine, EauSDB, gazCounter]
    );
    await db.close();
    process.exit(0);
  }
});

setTimeout(() => {
    // avoid locking the serial port for too long
    console.log("Exiting, process took too long to execute");
    process.exit(1);
}, 30000);
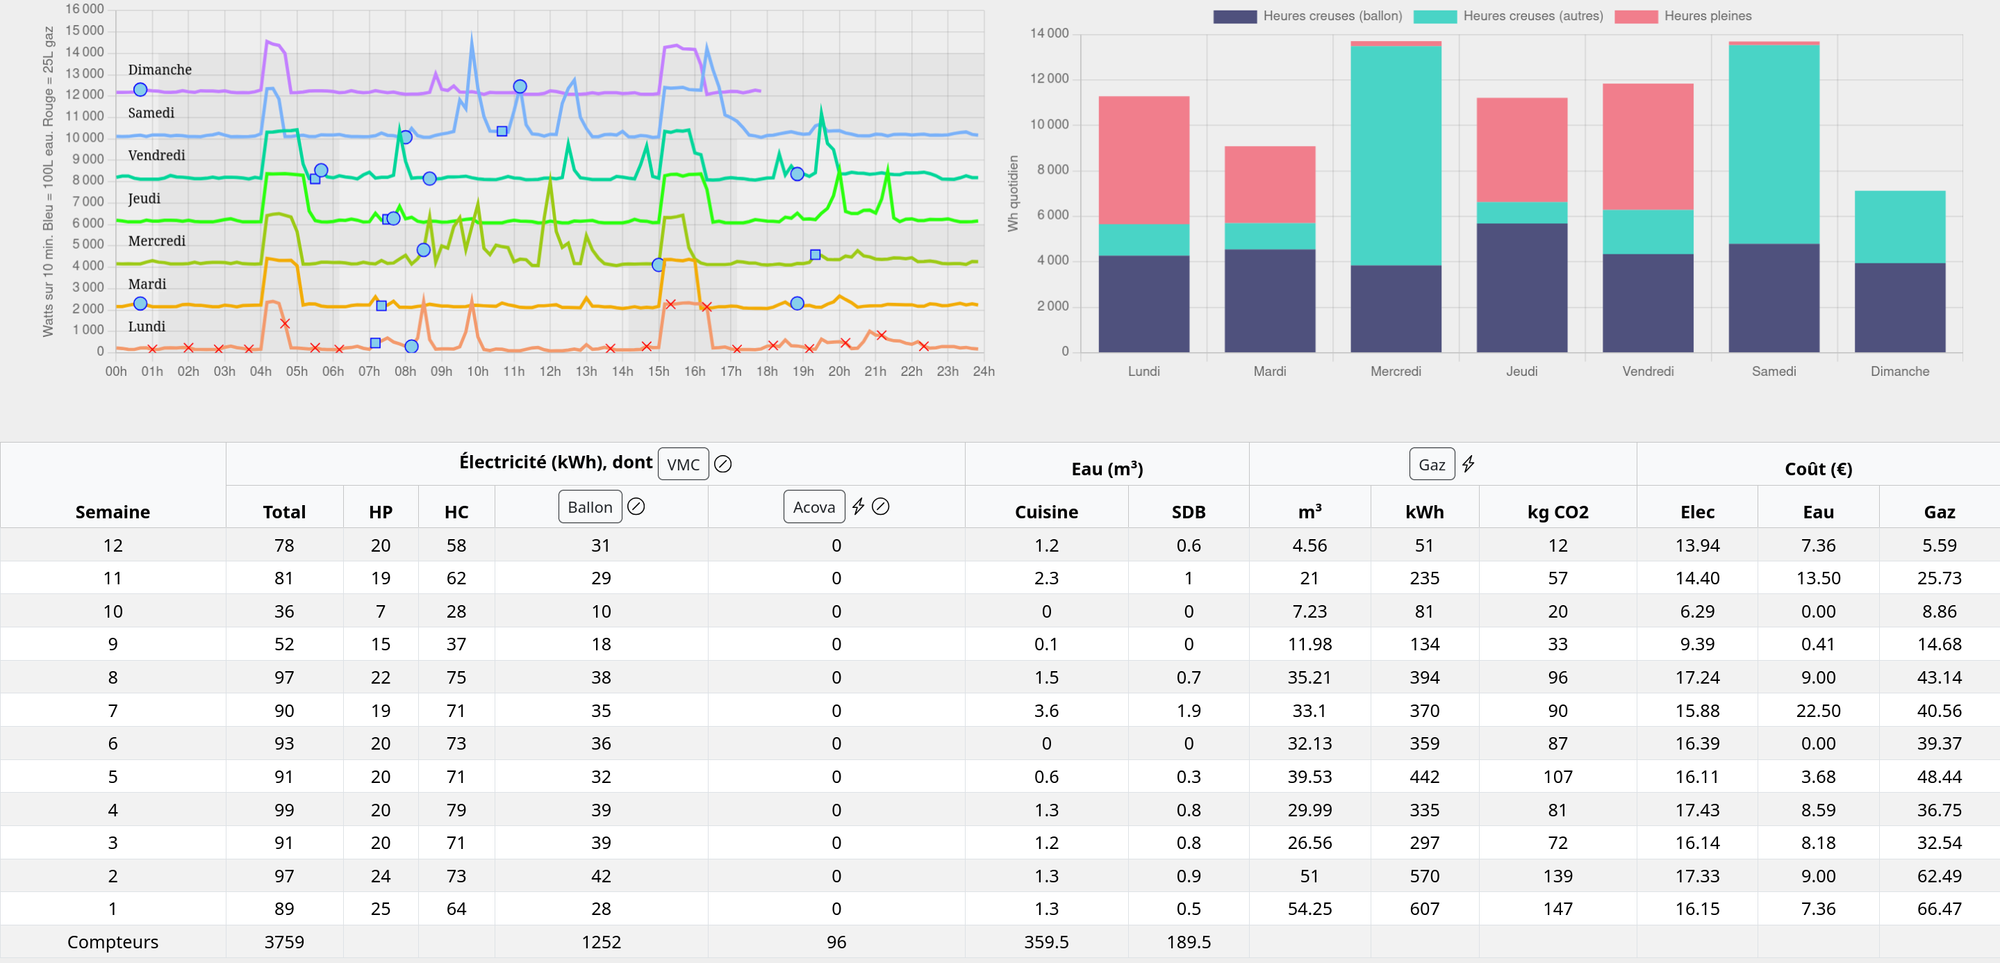
Then a small NodeJS server plus a templated HTML/JS page expose the UI to the users in the apartment.